GG Macros
The Gilbert Group Macros (GG Macros) were developed by Benjamin Gilbert (bgilbert@lbl.gov) and Pupa Gilbert (pupa@physics.wisc.edu). The GG Macros run on Mac and PC, are ready-to-use, free of charge, and are recommended to analyze synchrotron spectromicroscopy data, that is, images stacked as a function of photon energy, or polarization of the illuminating x-rays.
1. Download Igor Pro 8 or 9 from http://www.wavemetrics.com/
2. Download the GG Macros and their Manual from GitHub: https://github.com/b0gilbert/GG-macros.
3. Follow the instructions in the manual to place the macros in the correct folders on your computer.
4. Contact Pupa Gilbert at pupa@physics.wisc.edu if you have any questions.
5. If our GG Macros contribute to your work, please consider citing them using their Zenodo DOI: https://doi.org/10.5281/zenodo.17314121.
In a nutshell, the GG macros enable you to:
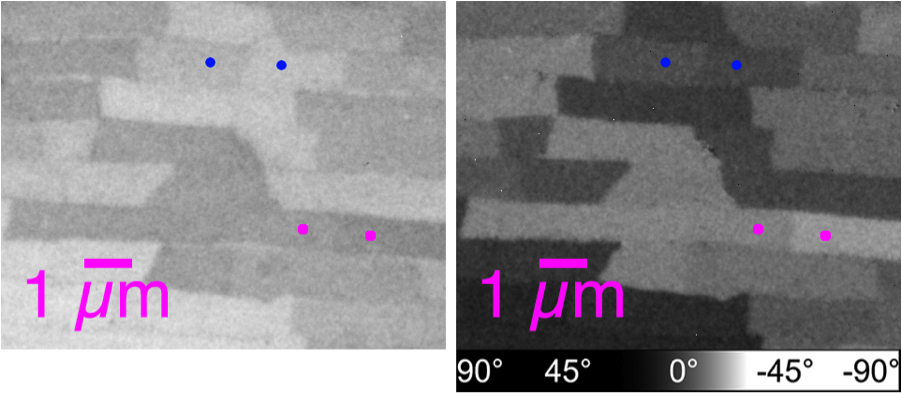
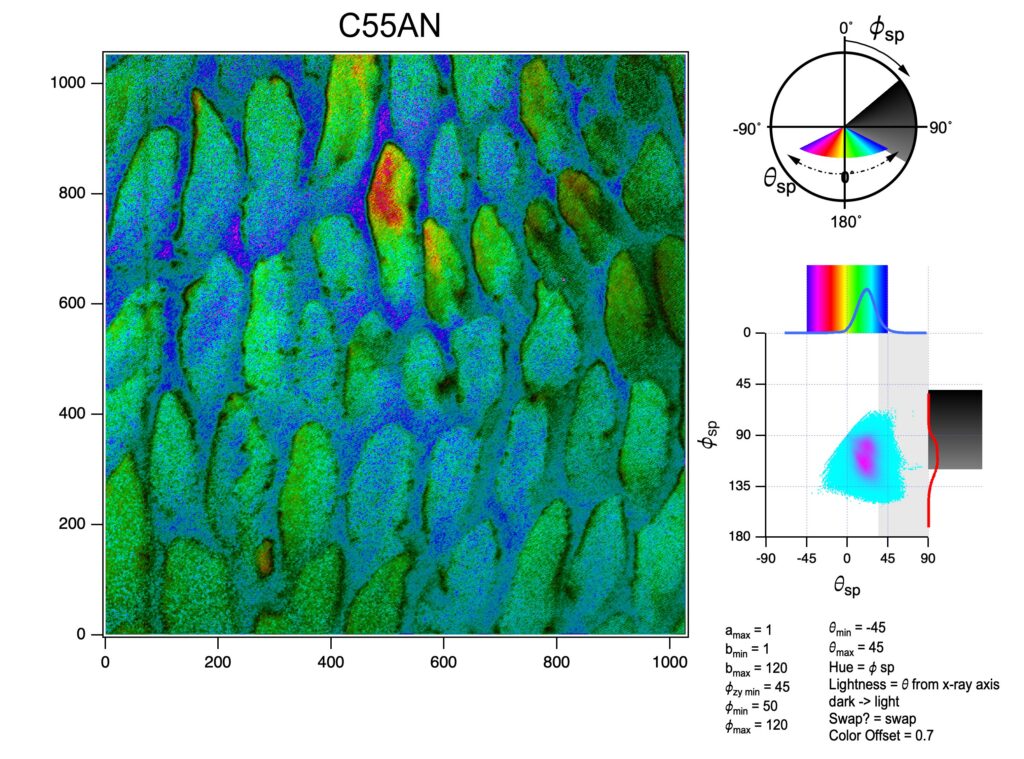
Do quantitative analysis of the orientation of carbonate crystals. For example, the aragonite (CaCO3) tablets in nacre can be distinguished by their crystal orientation as shown below. At a single linear polarization (left) two tablets (magenta dots, or blue dots) may display very similar gray levels, but their orientation can be quite distinct, when fully analyzed at multiple polarizations (see J4 in the manual).
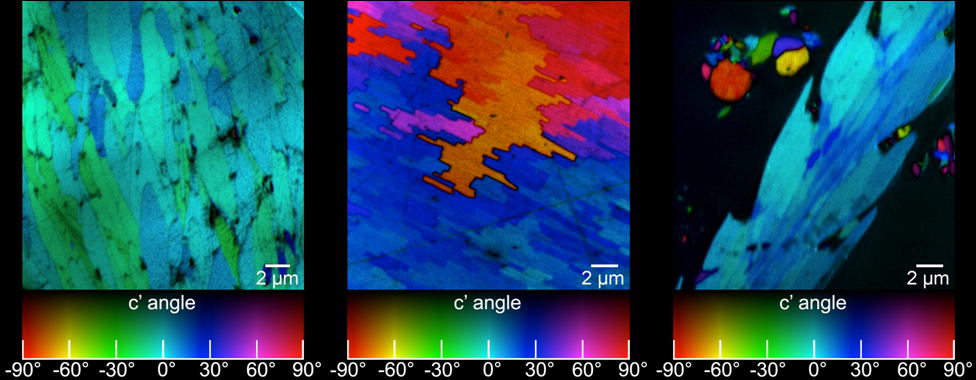
Obtain the 3D crystallographic orientation of carbonate crystals or apatite crystals using either PELICAN or PIC mapping. The in-plane orientation of the c-axis (termed c’ angle) is displayed as hue, and the out-of-plane orientation is displayed as brightness, from full color to black in PIC maps.
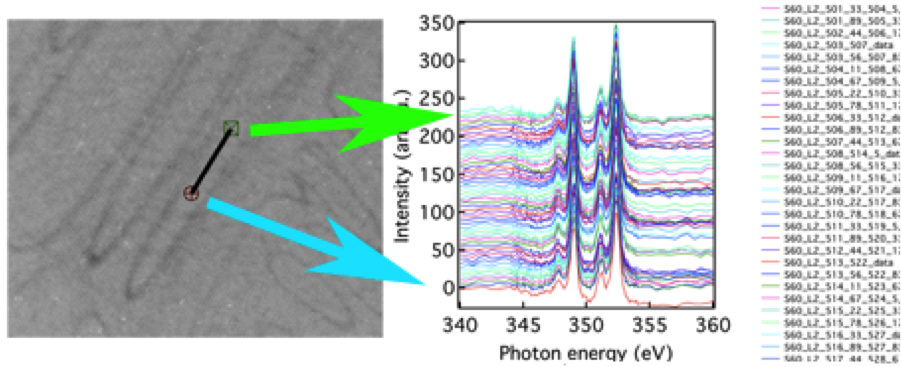
Extract spectra from mouse-drawn ROIs
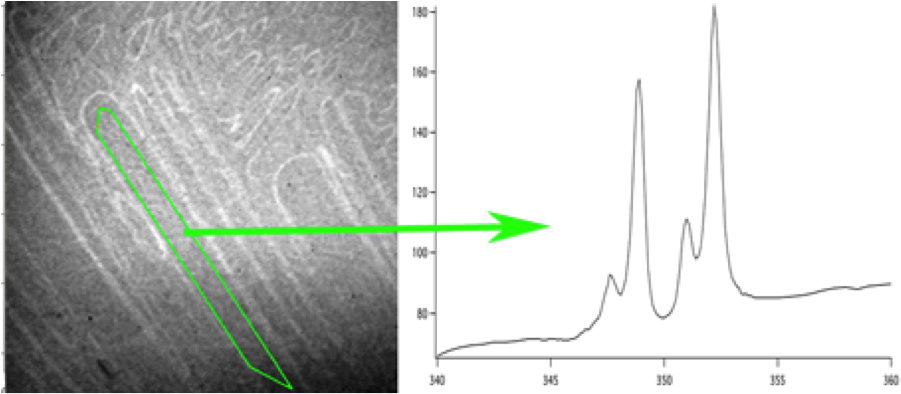
Extract spectra from a single pixel
![]()
Extract spectra from pixels along a line
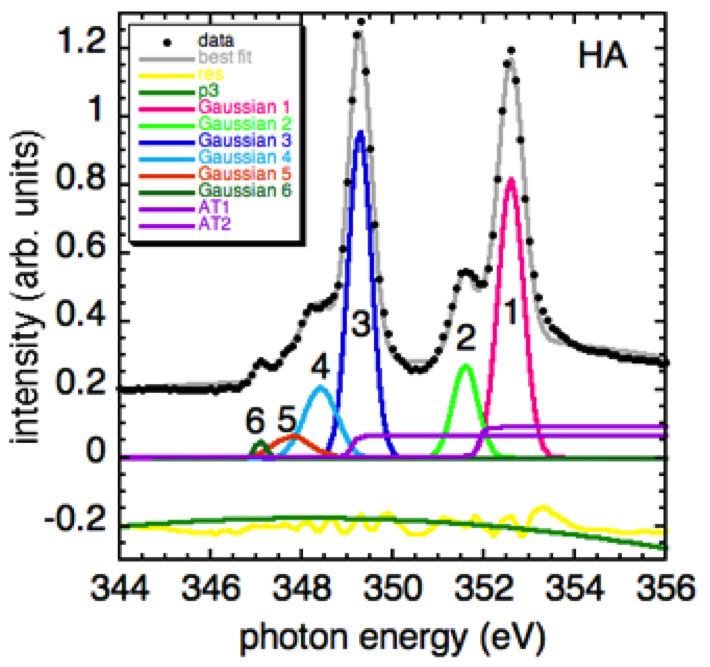
Do peak fitting of extracted spectra
Display the spatial distribution of individual components with known spectra
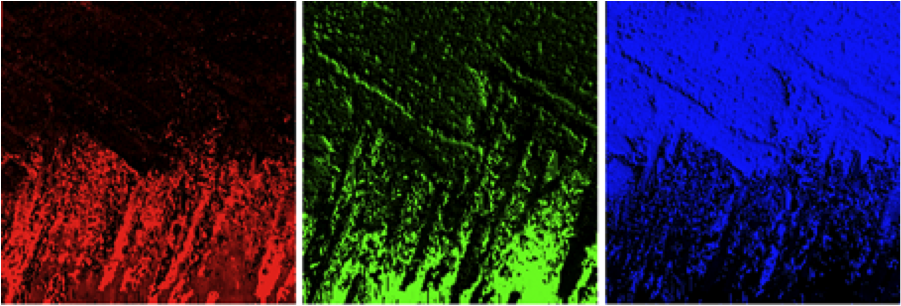
The individual components and their relative concentrations can then be combined in a quantitative “Component Map” if there are 1, 2, or 3 component in the system analyzed, or Myriad Map (MM) if there are more than 3 components. See J4 or J5 in the Manual for component maps or MMs.

You can calculate Polarization-Enabled Large Input of Crystal Angles at the Nanoscale (PELICAN) maps. See K in the Manual for PELICAN mapping.
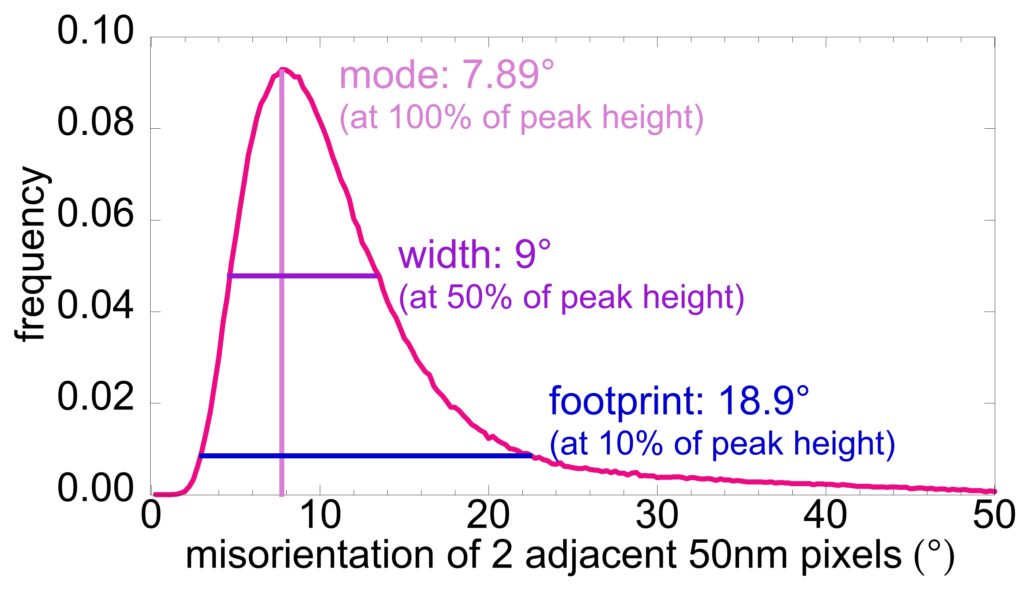
You can extract histograms of misorientations from every pair of adjacent pixels in the PELICAN map. Making sure that the pixel size is well-matched to the nanocrystal size provides the most significant information.